My Facebook Network
I am taking a coursera class on Social Network Analysis. The first assignment consisted of ploting my Facebook network. Below I show how I did it using the R package igraph. In order to get your Facebook Network you can use the Netvizz app. This application allows you to create gdf files (a simple text format that specifies an undirected graph) from the friendship relations. I used this simplified Netvizz version from coursera that generates .gml files directly.
library(igraph)

# read the facebook network from a .gml file
f <- read.graph("sdaza.gml", format = "gml")
In order to plot my Facebook network, I extract the following attributes: gender, wall posts count, and interface language. I also assign some colors and shapes to those attributes.
# gender, assigning shapes
ssex <- V(f)$sex
table(ssex)
## ssex
## female male
## 218 188ssex[ssex == "female"] <- "circle"
ssex[ssex == "male"] <- "square"
table(ssex)## ssex
## circle square
## 218 188# interface language, assigning colors
cloc <- V(f)$locale
table(cloc)## cloc
## en_GB en_US es_CL es_ES es_LA it_IT nl_NL pt_BR
## 13 132 2 9 245 1 1 3cloc[cloc %in% c("es_ES", "it_IT", "nl_NL", "en_GB", "gl_ES", "ko_KR")] <- "Yellow"
cloc[cloc %in% c("es_CL", "pt_BR", "es_LA")] <- "Green"
cloc[cloc == c("en_US")] <- "Blue"
table(cloc)## cloc
## Blue Green Yellow
## 132 250 24# wall posts count, assigning node size
nsize <- (V(f)$wallcount/max(V(f)$wallcount) + 0.1) * 15Now, I can plot the network:
plot(f, layout = layout.fruchterman.reingold, edge.arrow.size = 0.5,
    vertex.label = NA, vertex.size = 3, vertex.color = cloc,
    vertex.shape = ssex)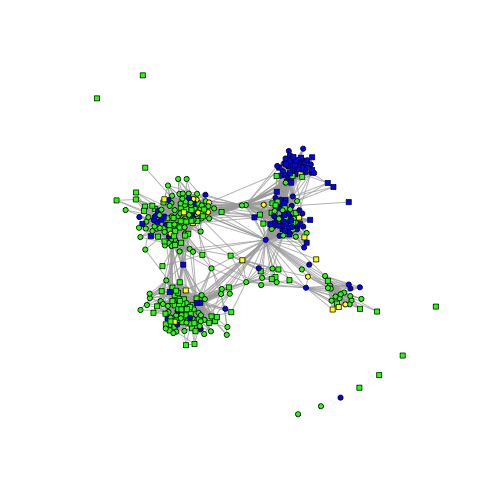
If we use wall posts count to size the nodes:
plot(f, layout = layout.fruchterman.reingold, edge.arrow.size = 0.5,
    vertex.label = NA, vertex.size = nsize, vertex.color = cloc,
    vertex.shape = ssex)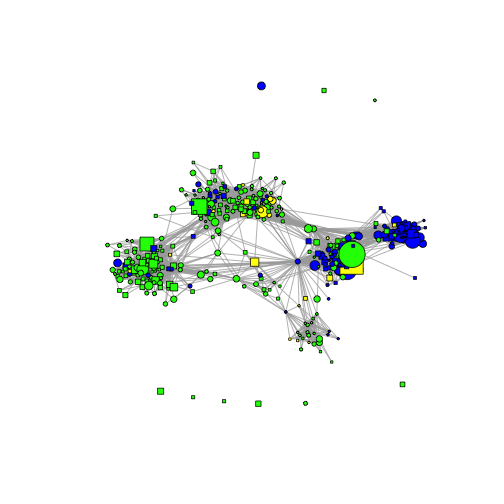
We can also obtain some basic descriptive statistics of the network using a graph.basic.stats function (see here to obtain it):
graph.basic.stats(f)## Number of nodes: 406
## Number of edges: 4415
##
## Degree
## Average: 21.7
##
##
## Giant component Size: 397
## Giant component As perc.: 0.978
## Second Giant component: 1
## Second Giant component As perc.: 0.00246
##
## Isolated nodes
## Number: 9
## As perc.: 0.0222As can be seen, I have relatively compact and homogeneous components (or clusters) regarding language interface on Facebook. You can see now how your own Facebook network looks like.