Oh, descriptive tables (R + Latex)!
It’s been a while since my last post. It’s time to catch up!
Every time I write a paper or report, I need to create descriptive tables using Latex. Over and over I create Adhoc tables, and I say to myself: Write a general function so you can save time in the next paper! I know there are some solutions out there, but in general, I feel they are not flexible enough.
I introduce a far from perfect function to create descriptive tables in Latex. The steps and structure are quite simple:
- Write a function to summarize your data with any stats you want
- Define a list with the data plus column names (labels)
That’s it. You can see the function here. It has some features might be useful:
- It deals automatically with factors (categorical variables)
- You can use different datasets at the same time
- You can group columns using a variable (e.g., year)
- You can add long notes at the bottom of the table
- You can specify your own descriptive function
Let’s start creating some fake data:
- 5 variables
- Variable 3 is a factor (i.e., categorical)
- Variable 5 is a grouping column
library(data.table)
set.seed(14332)
devtools::source_gist("c4d1089a501d3567be9fb784b1c5a6ab")
# create two fake datasets
n1 = 100
dat1 = data.table(
var1 = runif(n1),
var2 = sample(0:1, n1, prob = c(0.8, 0.2), replace = TRUE),
var3 = factor(sample(1:4, n1, prob = c(0.1, 0.4, 0.3, 0.2),
replace = TRUE),
labels = c("Low", "Medium", "High", "Very high")),
var4 = rnorm(n1, 1000, 100),
var5 = sample(1:4, n1, replace = TRUE)
)
n2 = 200
dat2 = data.table(
var1 = runif(n2, min = 3, max = 5),
var2 = sample(0:1, n2, prob = c(0.5, 0.5), replace = TRUE),
var3 = factor(sample(1:5, n2, prob = c(0.05, 0.1, 0.35, 0.3, 0.2),
replace = TRUE),
labels = c("Very low", "Low", "Medium", "High", "Very high")),
var4 = rnorm(n2, 2000, 300),
var5 = sample(1:4, n2, replace = TRUE)
)
datasets = list("Data 1" = dat1, "Data 2" = dat2)
variables = list(paste0("var", 1:4), paste0("var", 1:4))
labels = list(paste0("Variable ", 1:4), paste0("Variable ", 1:4))
colnames = c("Mean", "Median", "SD")We can define a descriptive function:
# descriptive function
myDescriptives = function(x) {
    x = as.numeric(x)
    m = mean(x, na.rm = TRUE)
    md = median(x, na.rm = TRUE)
    sd = sd(x, na.rm = TRUE)
    return(c(m, md, sd))
}
# create table
createDescriptiveTable(datasets,
summary_function = myDescriptives,
column_names = colnames,
variable_names = variables,
variable_labels = labels,
arraystretch = 1.3,
title = "Descriptive statistics",
label = "tab:descriptive",
file = "example_01.tex")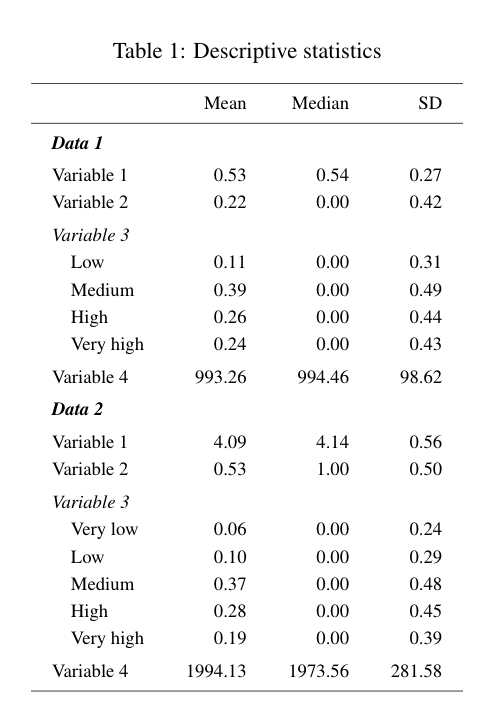
Thus, the grouping of rows is defined by the name of each dataset in the list. We can add a note, just remember to add \usepackage[flushleft]{threeparttable} to your Latex document:
# table + note
createDescriptiveTable(datasets,
    summary_function = myDescriptives,
    column_names = colnames,
    variable_names = variables,
    variable_labels = labels,
    arraystretch = 1.3,
    note = "This is a very long long long long long long long long long note.",
    title = "Descriptive statistics",
    label = "tab:descriptive",
    file = "example_02.tex")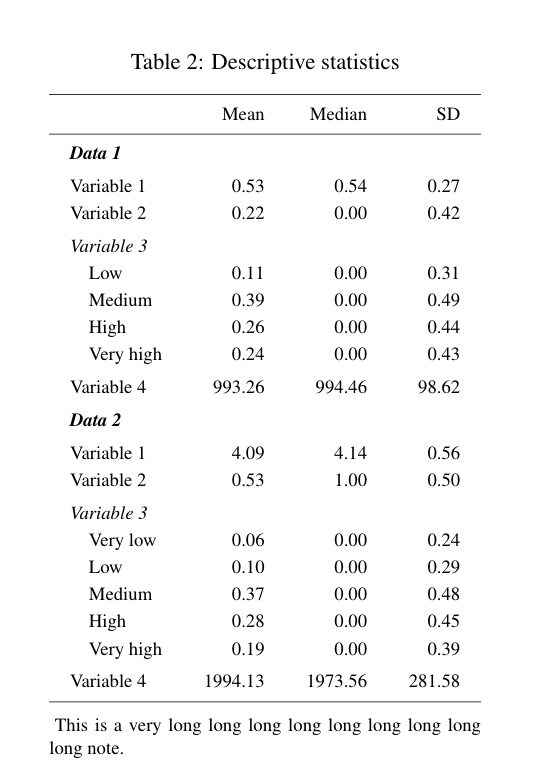
We can also slice the descriptives by group:
# group columns
createDescriptiveTable(datasets,
    summary_function = myDescriptives,
    column_names = colnames,
    variable_names = variables,
    variable_labels = labels,
    group_variable = "var5",
    arraystretch = 1.3,
    tabcolsep = 3,
    note = "This is a very long long long long long long long long long note.",
    title = "Descriptive statistics",
    label = "tab:descriptive",
    file = "example_03.tex")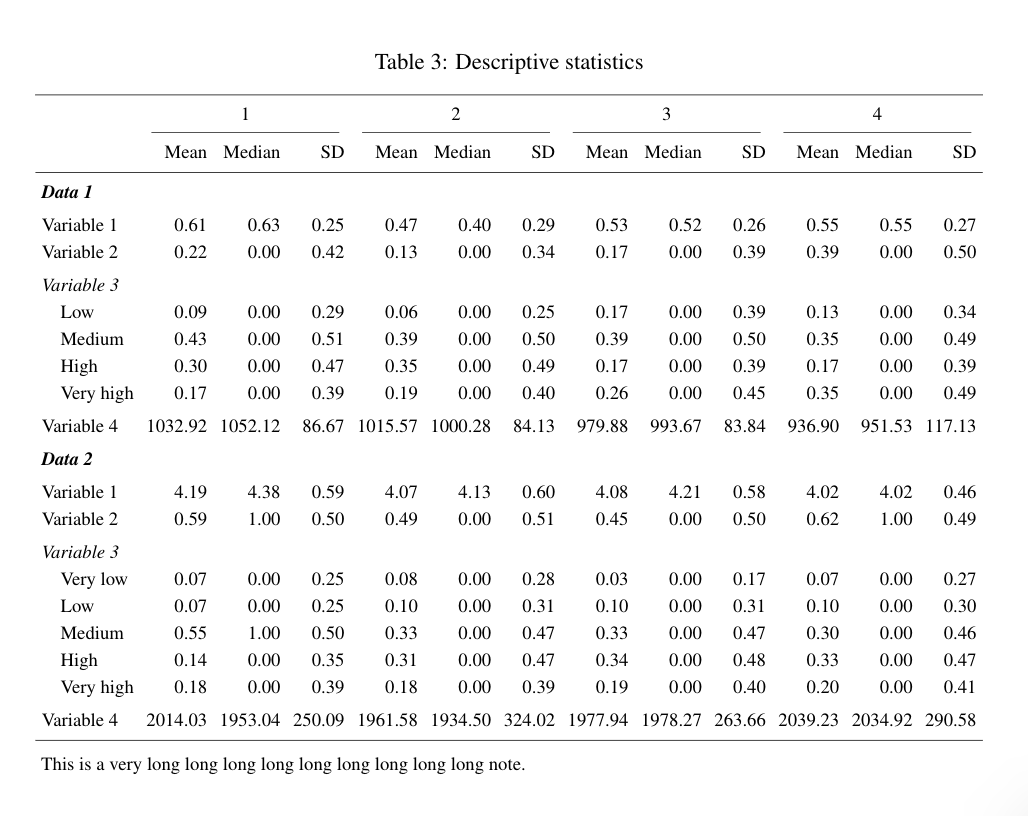
It’s just a first version. I will add more features soon.